Compiler Explorer
Or the 'compiler magic' edition!
This week’s post is about an amazing tool that is useful for anyone with an interest in compilers or computer architecture. It’s Compiler Explorer, which we’ll abbreviate to CE from now on.
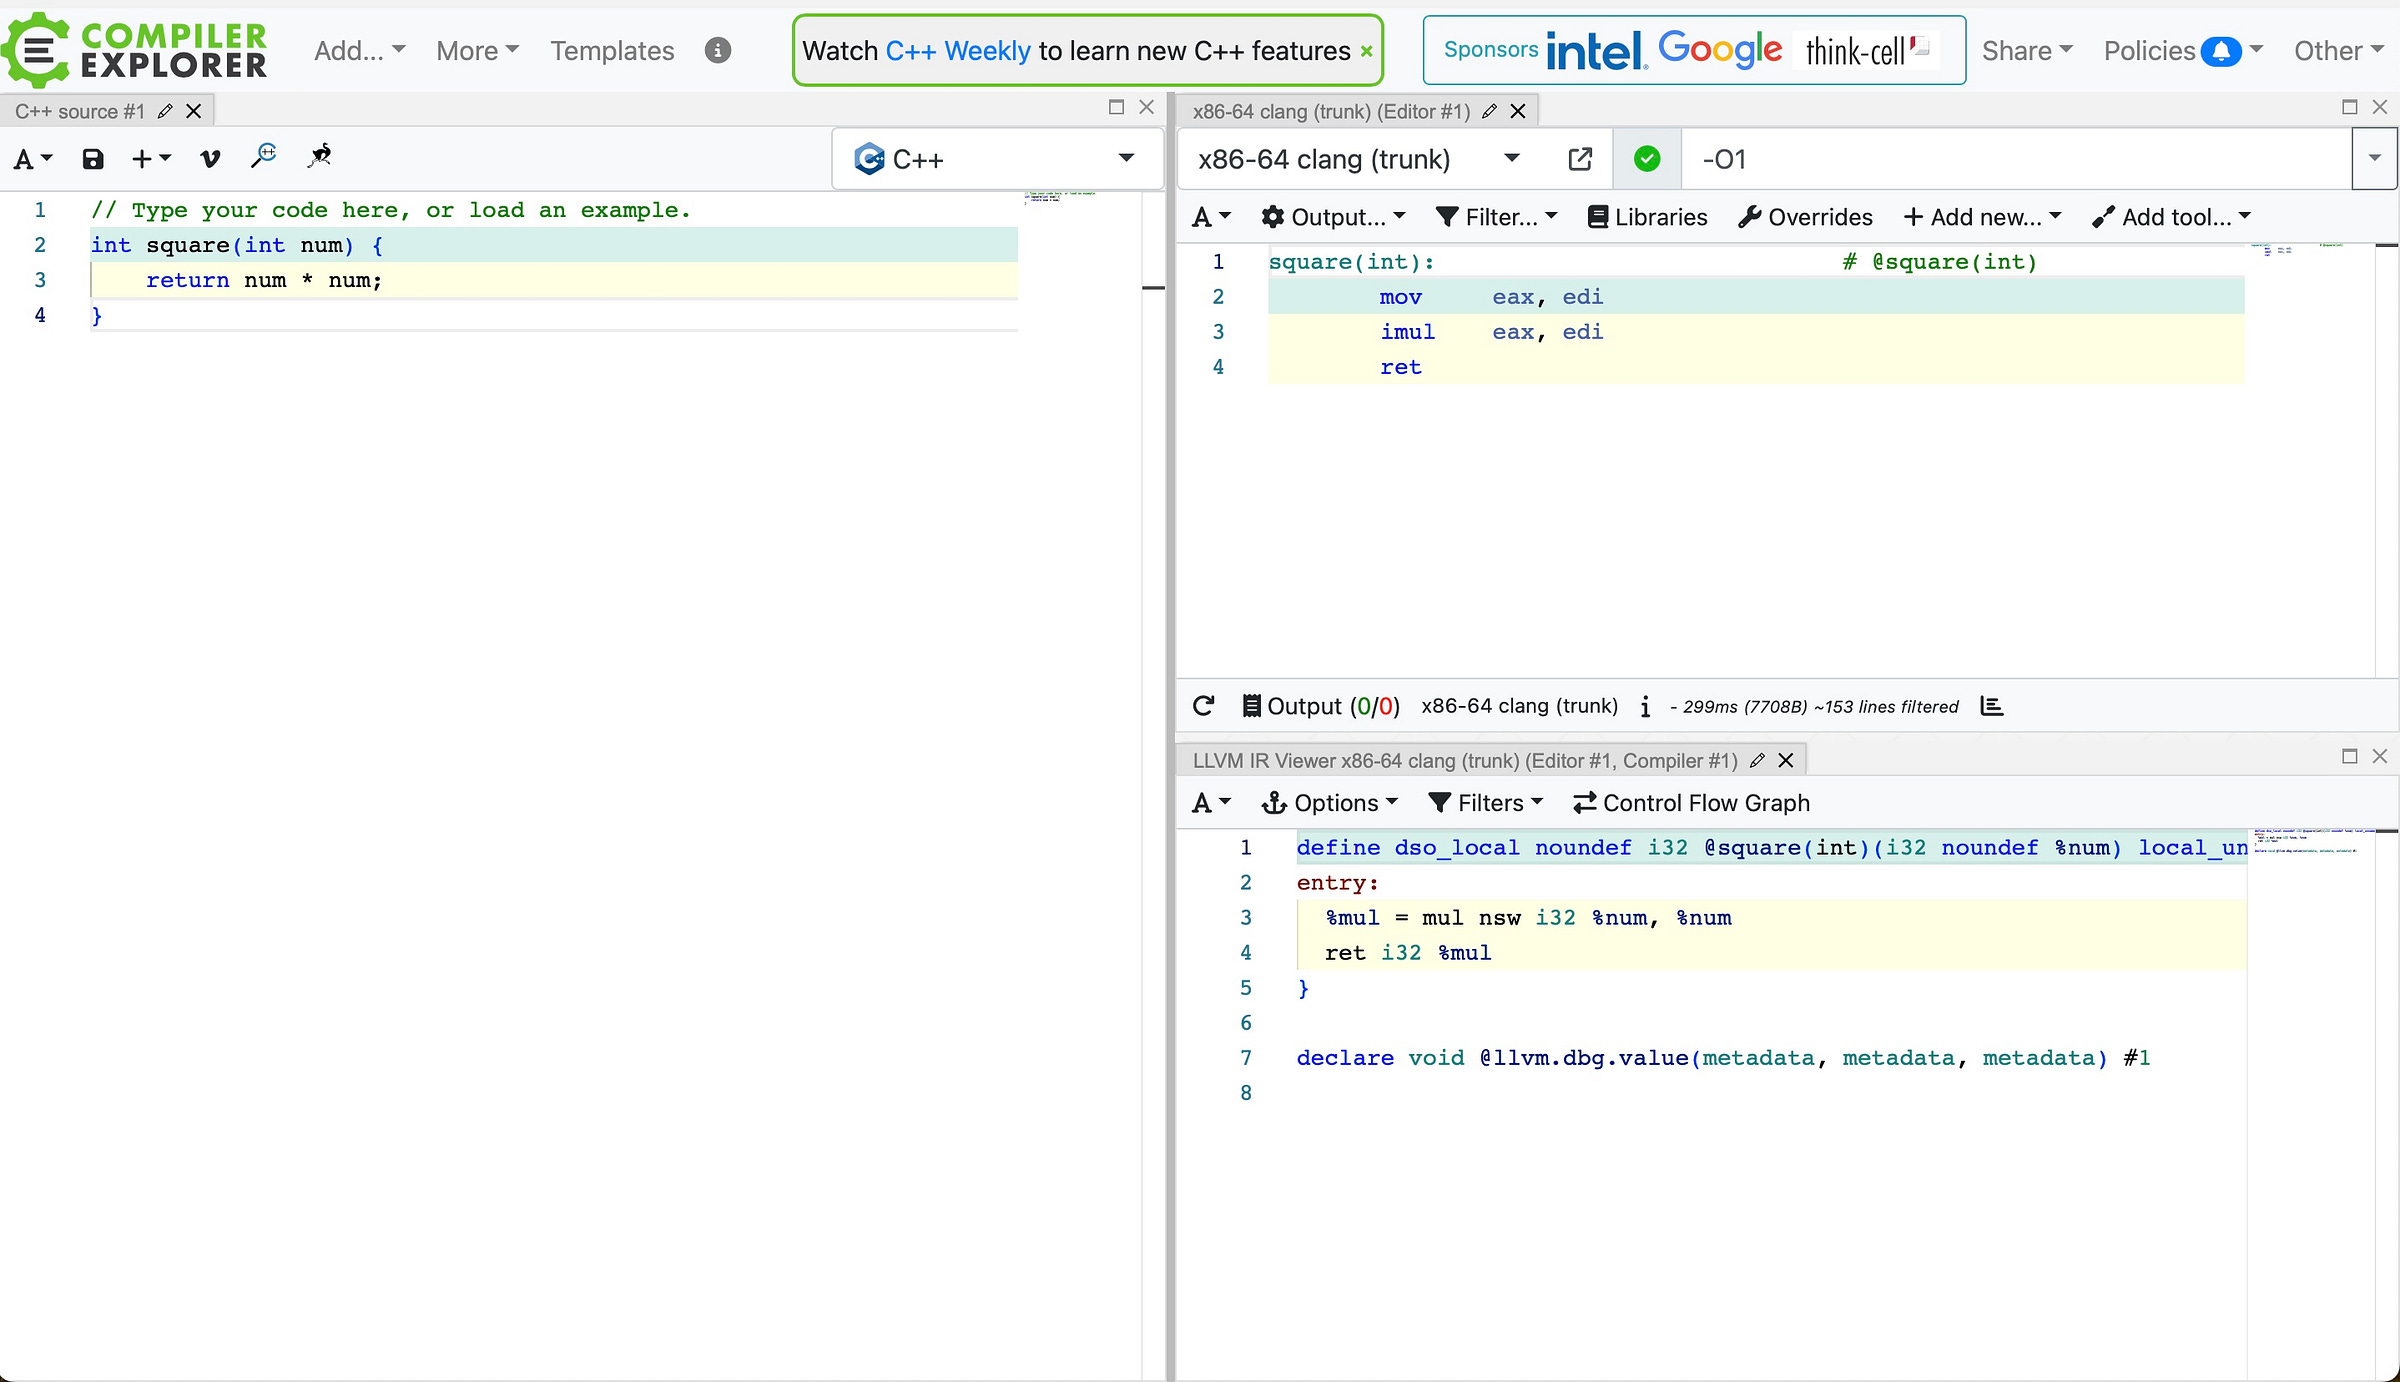
CE is an amazing tool. If you’re not familiar with CE, then it’s worth stopping right now and going to the CE website, where you will be presented with a screen that should look something like the one below.
Disclaimer: We are now entering a ‘rabbit hole’ that may consume several hours of your time.
The basic idea behind CE is very simple. Just enter the source code in the pane on the left and the site will immediately show you the compiled output - typically assembly language - in a panel on the right.
CE supports sixty-nine source languages, over two thousand compilers, and a wide range of target architectures including x86, arm, risc-v, avr, mips, vax, tensa, 68k, PowerPC, SPARC, and even the venerable 6502.
So now seeing the output from a compiler for a snippet of code is as simple as opening https://godbolt.org, and copying your snippet in.
That’s amazing as it is but there is much, much more to CE.
It’s a tool that anyone with an interest in compilers or computer architecture should be familiar with. We can only ‘scratch the surface’ of CE in this post. It really is worth just heading over to the CE website and trying it out.
The Compiler Explorer Story
First though, the CE ‘back story’.
CE is hosted on https://godbolt.org as its original author is Matt Godbolt, who started the project back in 2012. From Matt’s blog on the 10th anniversary of CE.
Ten years ago I got permission to open source a little tool called GCC Explorer. I’d developed it over a week or so of spare time at my then-employer DRW in node.js, and the rest, as they say, is history.
After a few years it became clear that GCC Explorer was more than just GCC, and on 30th April 2014 the site became “Compiler Explorer” for the first time.
Matt recently shared the story of CE on the (really awesome) Microarch podcast from Dan Magnum.
The whole interview with Matt is worth a listen (links to Spotify, YouTube, and Apple Podcasts) as it’s full of interesting discussions of architecture, computer history, and, right at the end, CE.
Matt Godbolt joins to talk about early microprocessors, working in the games industry, performance optimization on modern x86 CPUs, and the compute infrastructure that powers the financial trading industry. We also discuss Matt’s work on bringing YouTube to early mobile phones, and the origin story of Compiler Explorer, Matt’s well-known open source project and website.
Matt himself also has a podcast with Ben Rady - Two’s Complement - including this recent episode on the future of CE (links to Spotify, YouTube, and Apple Podcasts) which shares a lot more about the current status of the project.
CE is open-source with the source hosted on GitHub which means that, if you have the time and expertise, then it’s possible to self-host CE.
Most people will use the online CE version, which is free and supported by donations and sponsorships.
As we’ll probably add some load to CE, I’ll donate 100% of the value of new Annual Subscriptions generated by this post to help support CE.
Alternatively, readers can donate directly to the CE project via PayPal at this link.
Compiler Explorer Features
What can we use CE for? Matt Godbolt gave a talk earlier this year that provides a great overview of CE and many of its uses including some of the latest features.
Let’s quickly dip into some of the simplest ways we can use CE.
Exploring Architectures
We can compare the assembly language output for a variety of architectures. How does x86-64 code compare to ARM64 and RISC-V? We can get the answer in just a few moments. Here is x86-64 (all these examples are created with GCC 14.1):
square(int):
        push    rbp
        mov     rbp, rsp
        mov     DWORD PTR [rbp-4], edi
        mov     eax, DWORD PTR [rbp-4]
        imul    eax, eax
        pop     rbp
        ret
And ARM64:
square(int):
        sub     sp, sp, #16
        str     w0, [sp, 12]
        ldr     w0, [sp, 12]
        mul     w0, w0, w0
        add     sp, sp, 16
        ret
And then RISC-V (64-bit):
square(int):
        addi    sp,sp,-32
        sd      ra,24(sp)
        sd      s0,16(sp)
        addi    s0,sp,32
        mv      a5,a0
        sw      a5,-20(s0)
        lw      a5,-20(s0)
        mulw    a5,a5,a5
        sext.w  a5,a5
        mv      a0,a5
        ld      ra,24(sp)
        ld      s0,16(sp)
        addi    sp,sp,32
        jr      ra
That’s RISCy enough. How about something CISCy like VAX?
square(int):
        .word 0
        subl2 $4,%sp
        mull3 4(%ap),4(%ap),%r0
        ret
Or a simple 8-bit CPU like the 6502:
square(int):                             ; @square(int)
        pha
        clc
        lda     __rc0
        adc     #254
        sta     __rc0
        lda     __rc1
        adc     #255
        sta     __rc1
        pla
        clc
        ldy     __rc0
        sty     __rc6
        ldy     __rc1
        sty     __rc7
        sta     (__rc6)
        ldy     #1
        txa
        sta     (__rc6),y
        lda     (__rc6)
        sta     __rc4
        lda     (__rc6),y
        tax
        lda     (__rc6)
        sta     __rc2
        lda     (__rc6),y
        sta     __rc3
        lda     __rc4
        jsr     __mulhi3
        pha
        clc
        lda     __rc0
        adc     #2
        sta     __rc0
        lda     __rc1
        adc     #0
        sta     __rc1
        pla
        rts
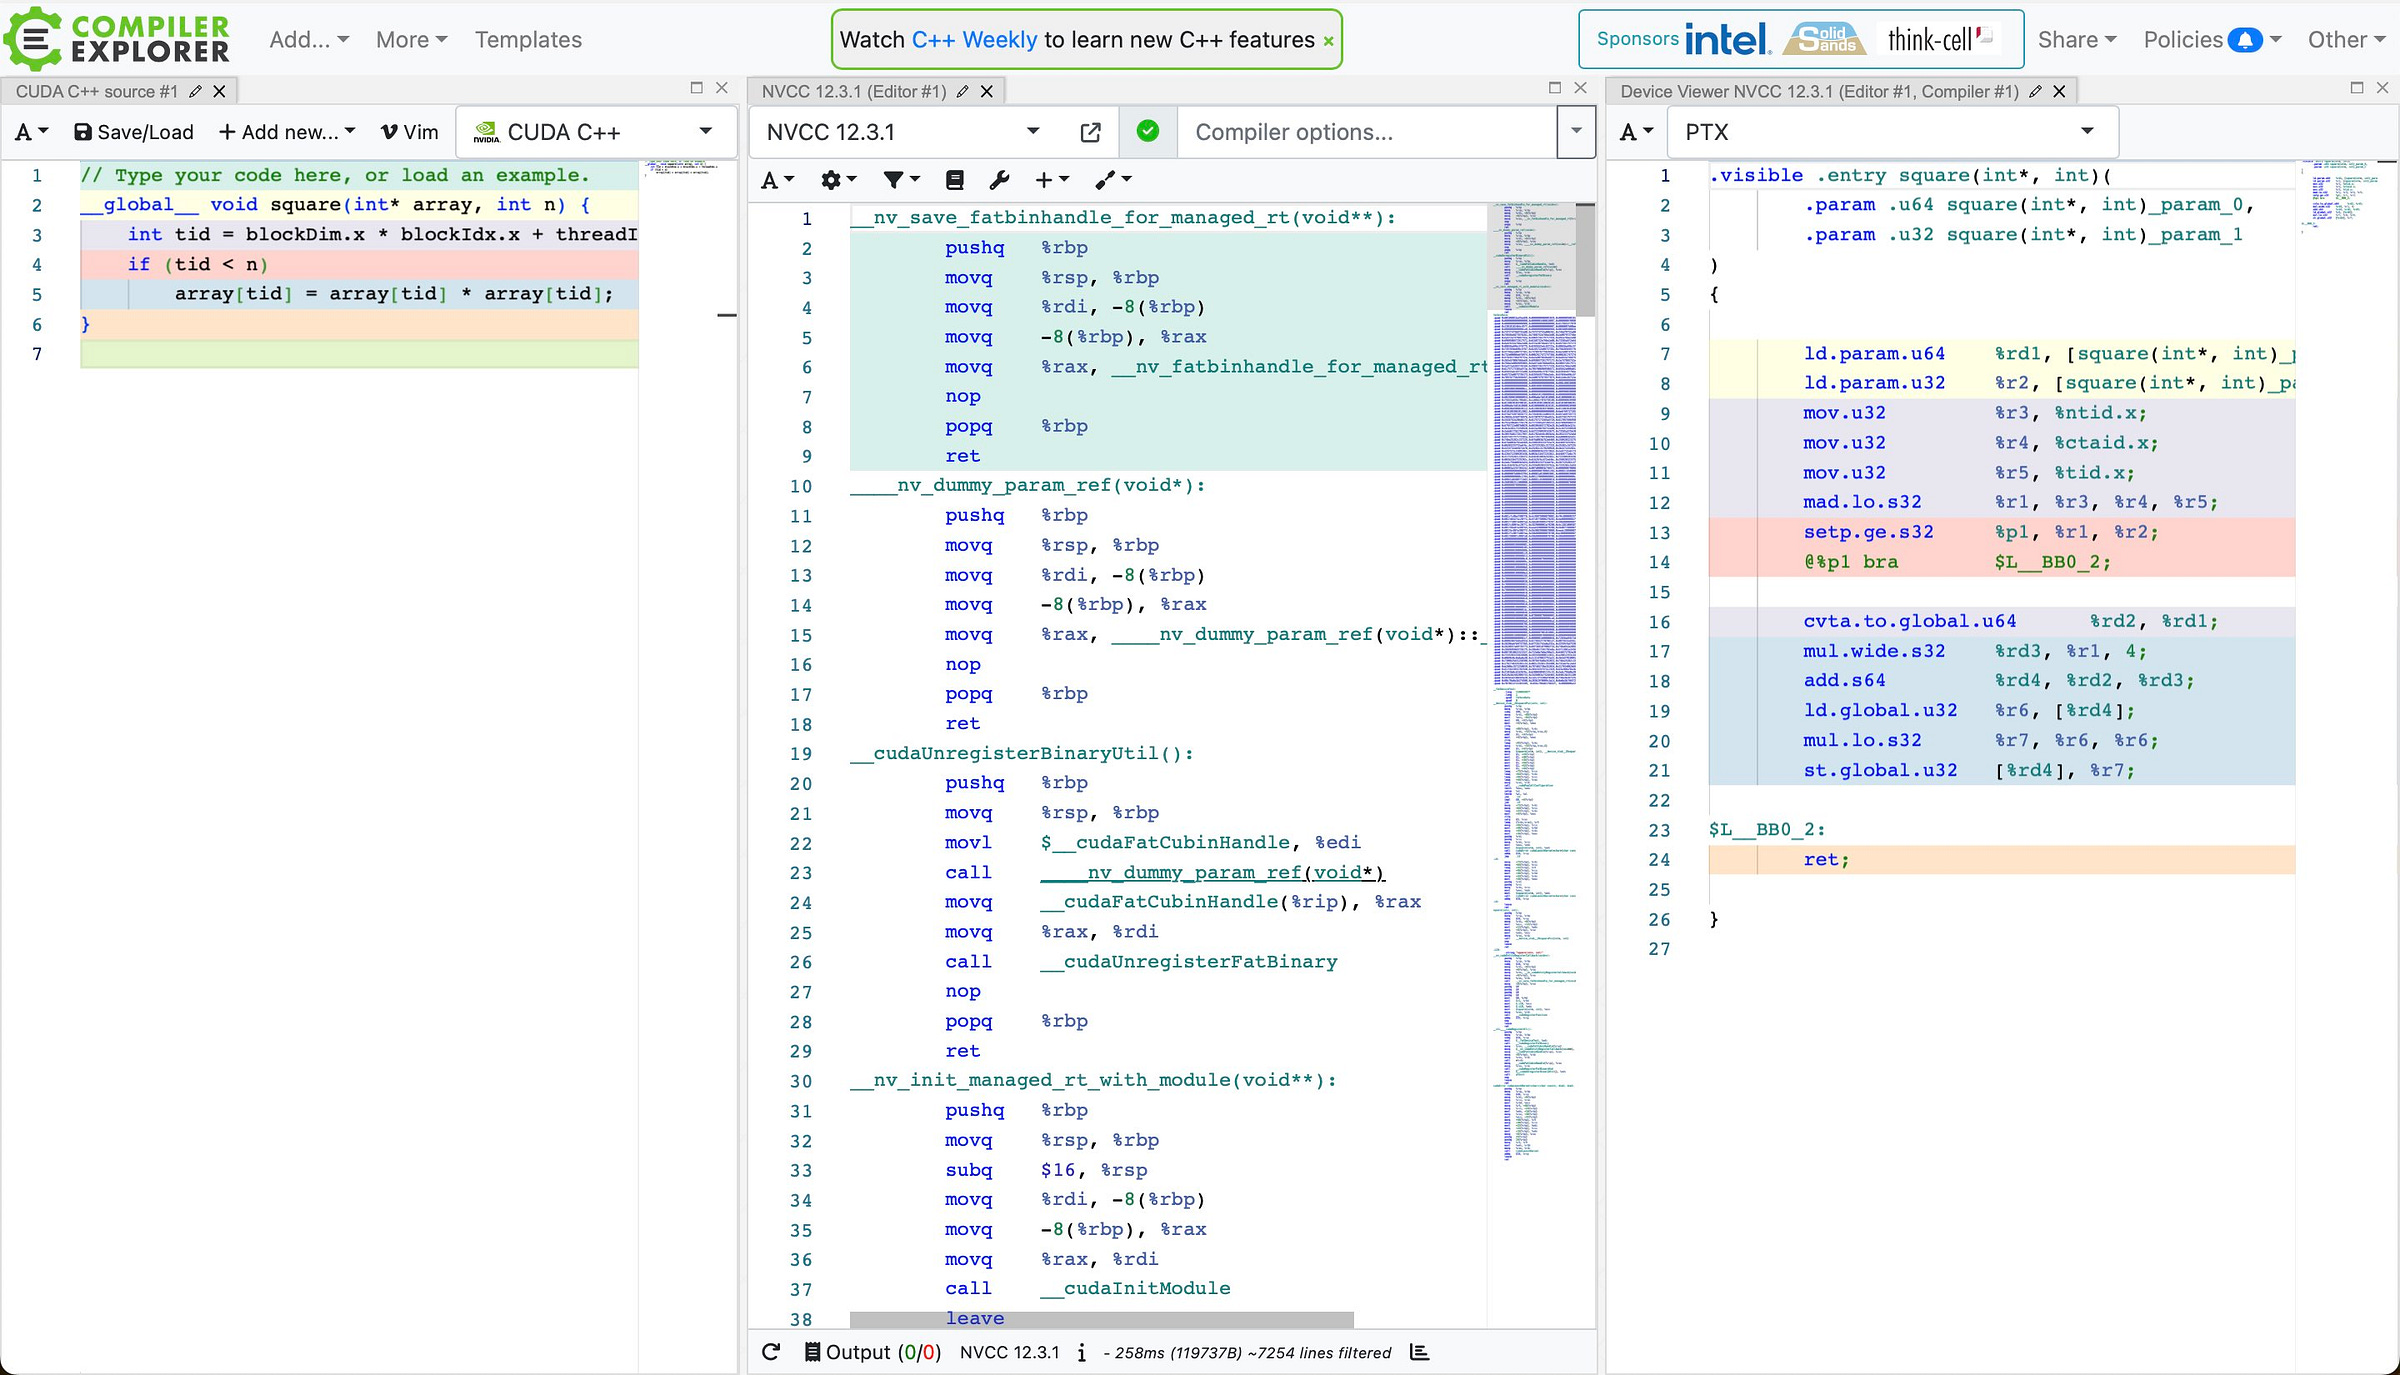
Finally, if you’re interested in Nvidia’s CUDA then CE will show you ptx code.
More on ptx in …
Demystifying GPU Compute Architectures
The complexity of modern GPUs needn’t obscure the essence of how these machines work. If we are to make the most of the advanced technology in these GPUs then we need a little less mystique. I think this is one of the most exciting times in computer architecture for many years. In CPUs we have x86, Arm and RISC-V, three increasingly well-supported application architectures.
Understanding Assembly Language
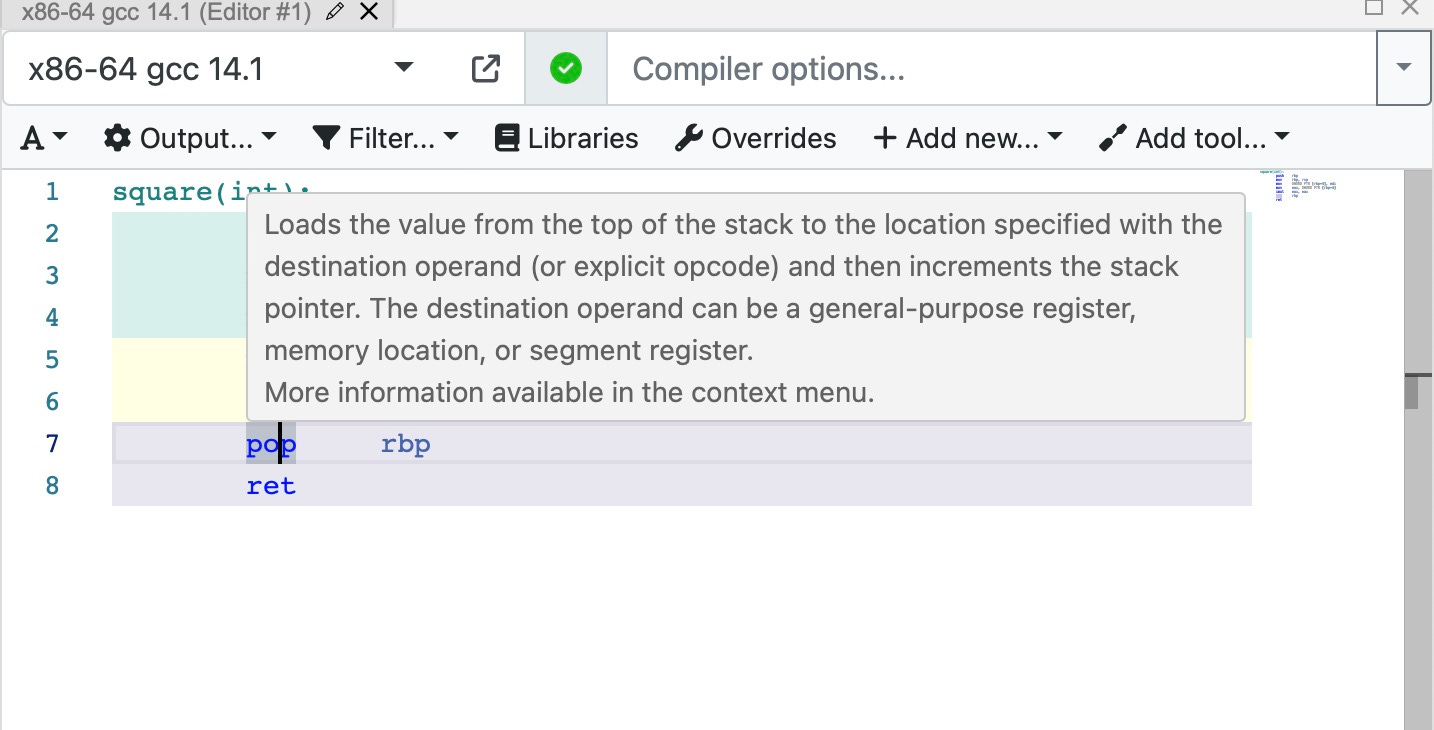
CE is a great tool for learning assembly language. We can ‘mouse over’ an instruction and we get a pop-up that describes the instruction.
Right-click on the instruction and we get a menu that takes us to a fuller description.
This in turn links to Felix Cloutier’s x86 instruction set documentation website.
Arm code goes to Arm’s documentation. I was a little sad, though, that there was no Vax assembly language documentation!
Comparing Compilers
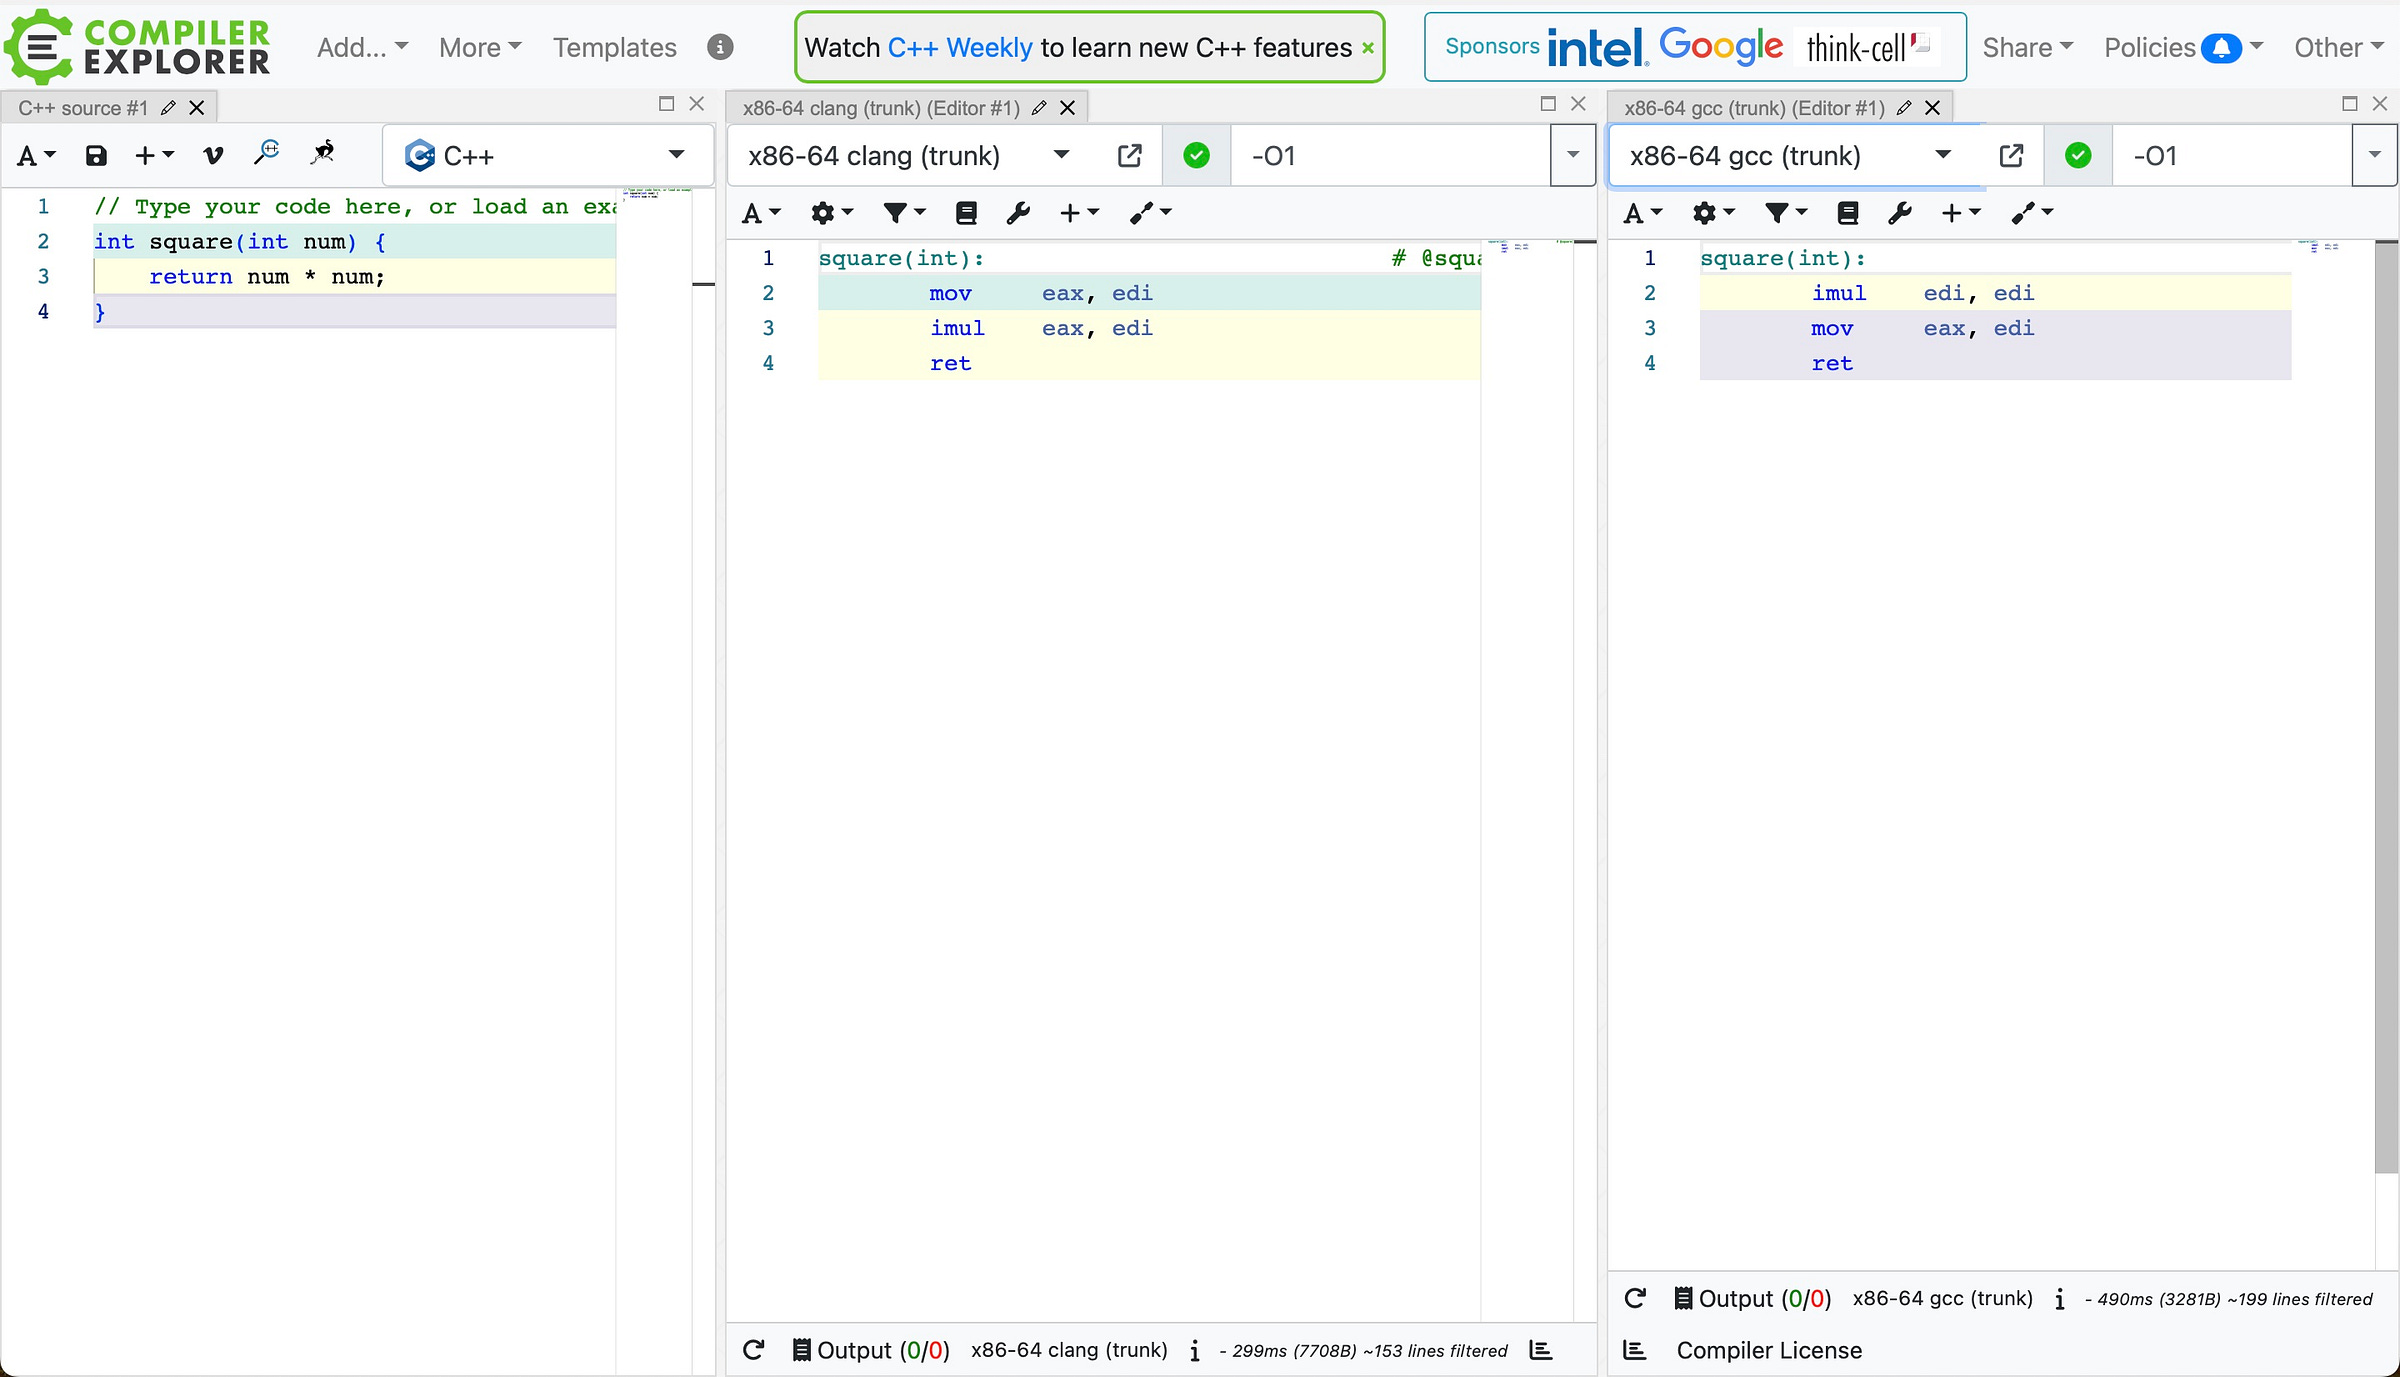
We can then compare the output from different compilers. Here is gcc vs clang. The generated code is unsurprisingly quite similar for this simple function!
LLVM Intermediate Representation
For LLVM-based compilers, CE can show the LLVM Intermediate Representation (or LLVM IR). LLVM IR is explained in more detail here:
Its flagship product is Clang, a high-end C/C++/Objective-C compiler. Clang follows the orthodox compiler architecture: a frontend that parses source code into an AST and lowers it into an intermediate representation, an “IR”; an optimizer (or “middle-end”) that transforms IR into better IR, and a backend that converts IR into machine code for a particular platform.
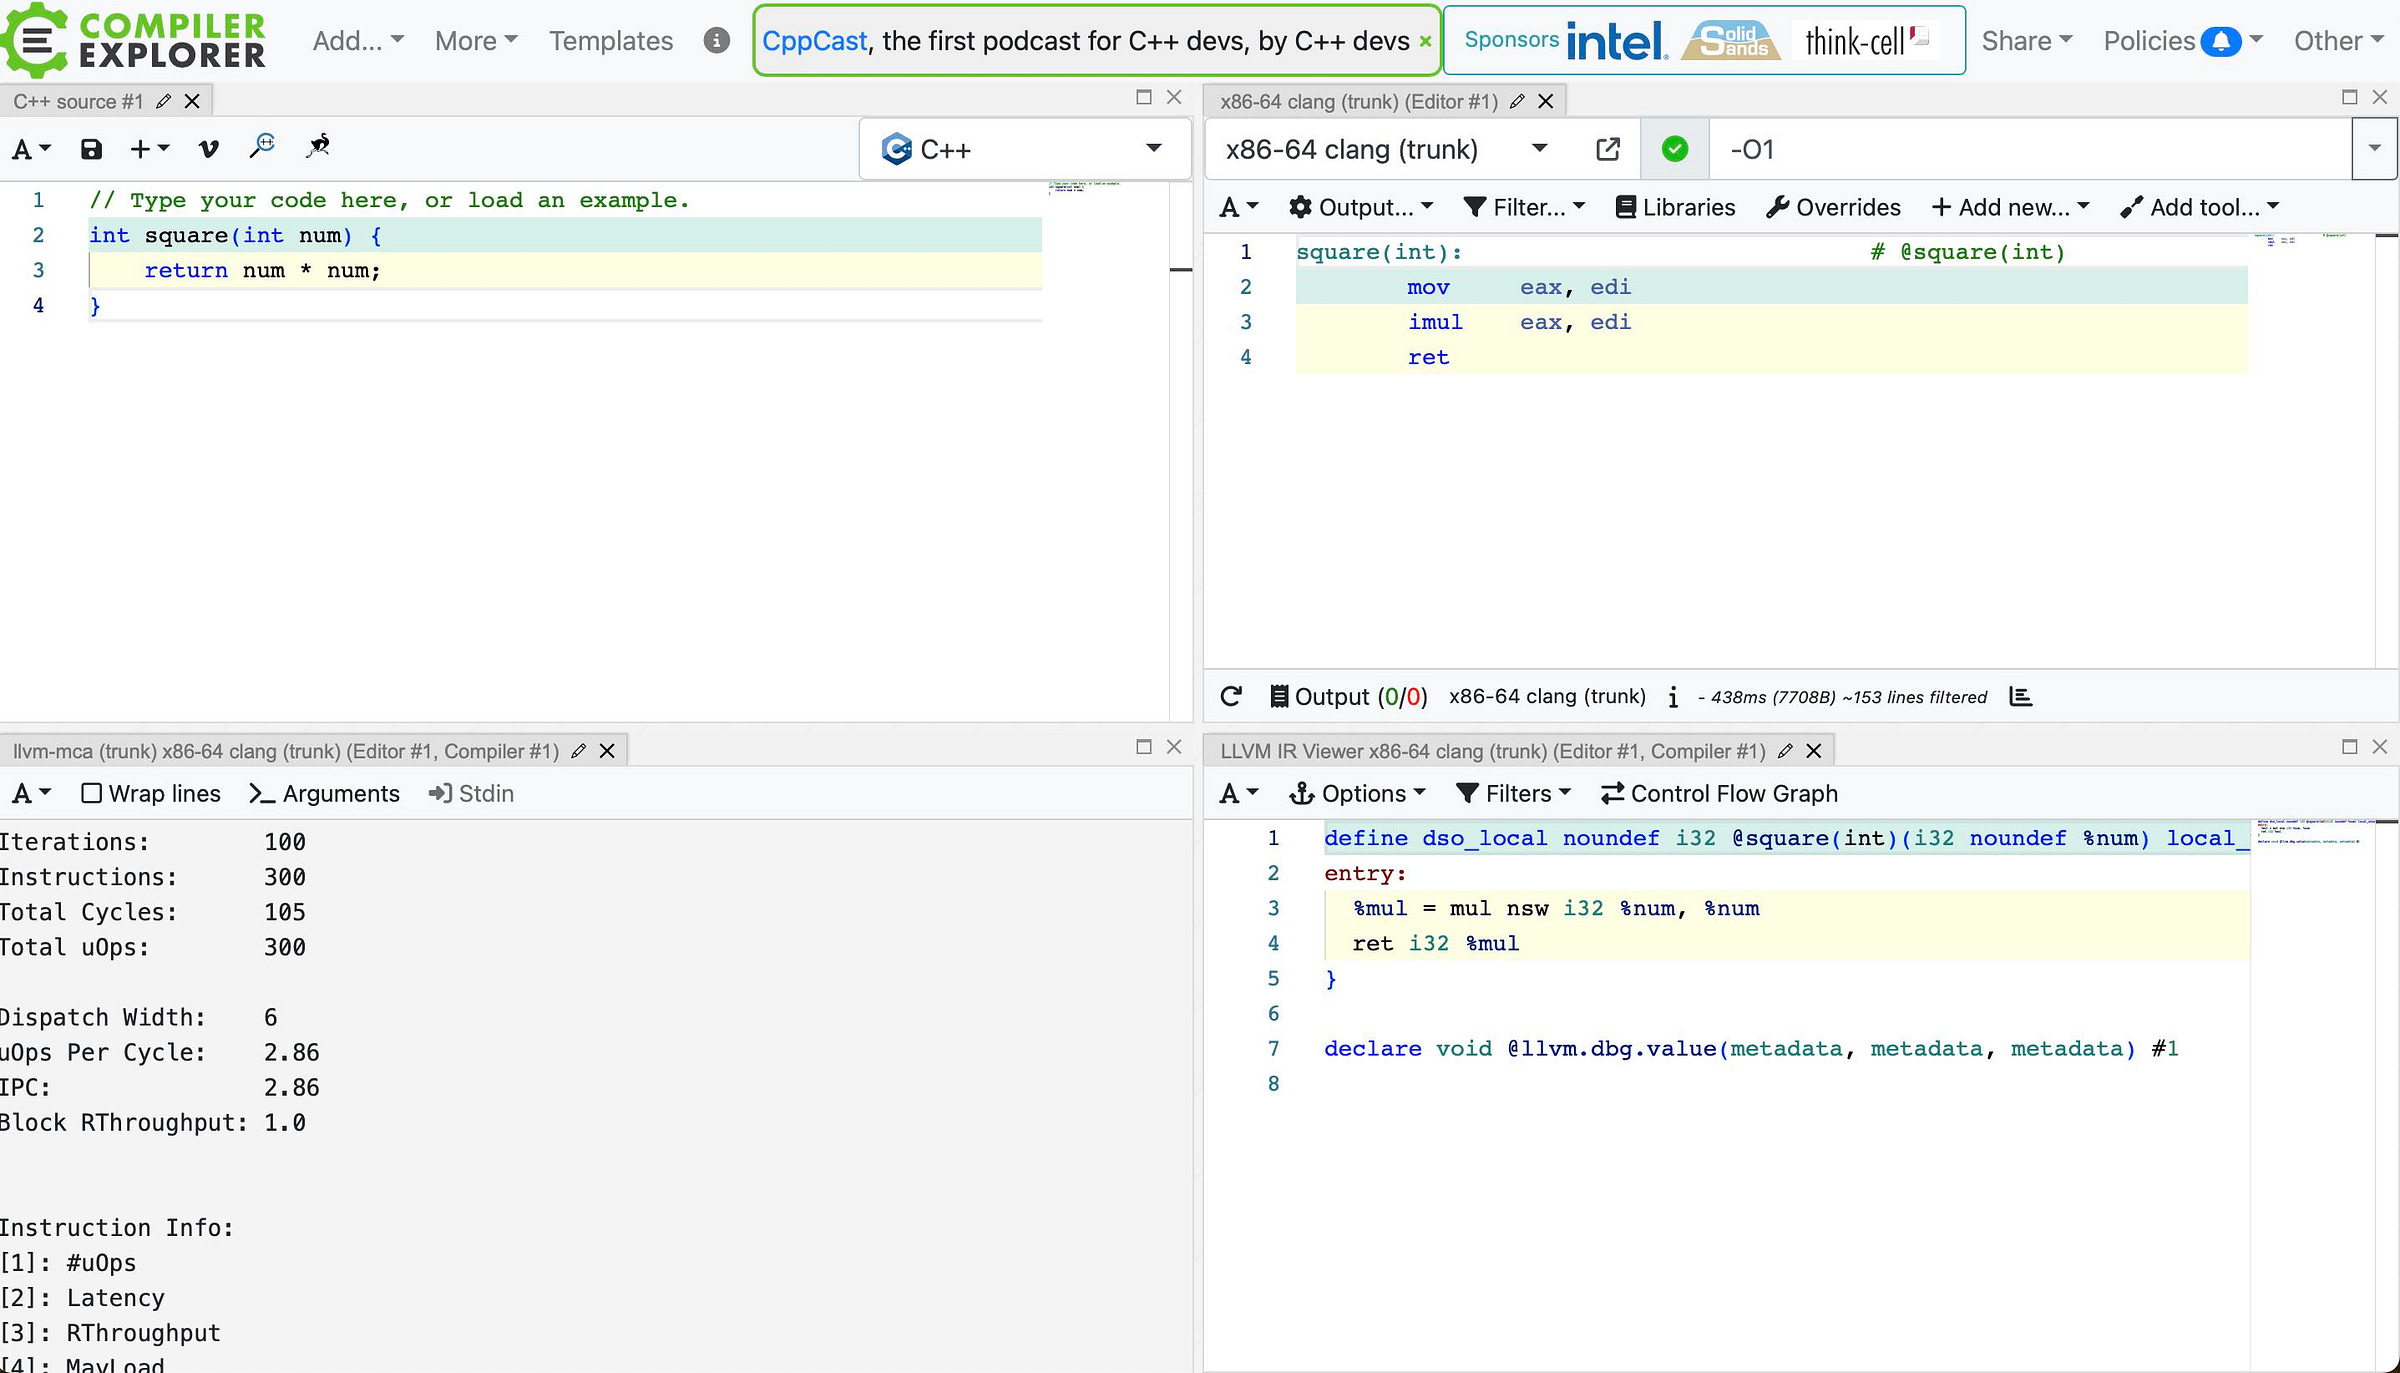
So LLVM is an intermediate step before the compiler produces assembly language. The LLVM IR is bottom right below:
LLVM Machine Code Analyzer
CE also provides access to lots of tools to help better understand our code and how it runs. For example, we can add the output of the LLVM Machine Code Analyzer (llvm-mca) which enables us to look in more detail at how machine code runs on a real CPU.
The llvm-mca window is bottom left.
llvm-mca simulates running your code on a real machine and provides some information on the expected performance.
For our simple example, llvm-mca tells us that we can expect 100 iterations to take 105 clock cycles on the simulated machine.
Iterations:        100
Instructions:      300
Total Cycles:      105
Total uOps:        300

Dispatch Width:    6
uOps Per Cycle:    2.86
IPC:               2.86
Block RThroughput: 1.0
If we add the -timeline option then we get a diagram that shows the timing of instructions as they progress through the CPU.
From the llvm-mca documentation:
The timeline view produces a detailed report of each instruction’s state transitions through an instruction pipeline. This view is enabled by the command line option
-timeline. As instructions transition through the various stages of the pipeline, their states are depicted in the view report. These states are represented by the following characters:
D : Instruction dispatched.
e : Instruction executing.
E : Instruction executed.
R : Instruction retired.
= : Instruction already dispatched, waiting to be executed.
- : Instruction executed, waiting to be retired.
Here is the timeline for our simple example:
Timeline view:
                    01234
Index     0123456789

[0,0]     DR   .    .   .   mov	eax, edi
[0,1]     DeeeER    .   .   imul	eax, edi
[0,2]     DeeeeeER  .   .   ret
[1,0]     D------R  .   .   mov	eax, edi
[1,1]     D=eeeE-R  .   .   imul	eax, edi
[1,2]     DeeeeeER  .   .   ret
[2,0]     .D-----R  .   .   mov	eax, edi
[2,1]     .D=eeeER  .   .   imul	eax, edi
[2,2]     .DeeeeeER .   .   ret
[3,0]     .D------R .   .   mov	eax, edi
[3,1]     .D==eeeER .   .   imul	eax, edi
[3,2]     .DeeeeeER .   .   ret
[4,0]     . D-----R .   .   mov	eax, edi
[4,1]     . D==eeeER.   .   imul	eax, edi
[4,2]     . DeeeeeER.   .   ret
[5,0]     . D------R.   .   mov	eax, edi
[5,1]     . D===eeeER   .   imul	eax, edi
[5,2]     . DeeeeeE-R   .   ret
[6,0]     .  D------R   .   mov	eax, edi
[6,1]     .  D===eeeER  .   imul	eax, edi
[6,2]     .  DeeeeeE-R  .   ret
[7,0]     .  D-------R  .   mov	eax, edi
[7,1]     .  D====eeeER .   imul	eax, edi
[7,2]     .  DeeeeeE--R .   ret
[8,0]     .   D-------R .   mov	eax, edi
[8,1]     .   D====eeeER.   imul	eax, edi
[8,2]     .   DeeeeeE--R.   ret
[9,0]     .   D--------R.   mov	eax, edi
[9,1]     .   D=====eeeER   imul	eax, edi
[9,2]     .   DeeeeeE---R   ret
Interpreted Languages: Python, Ruby, etc
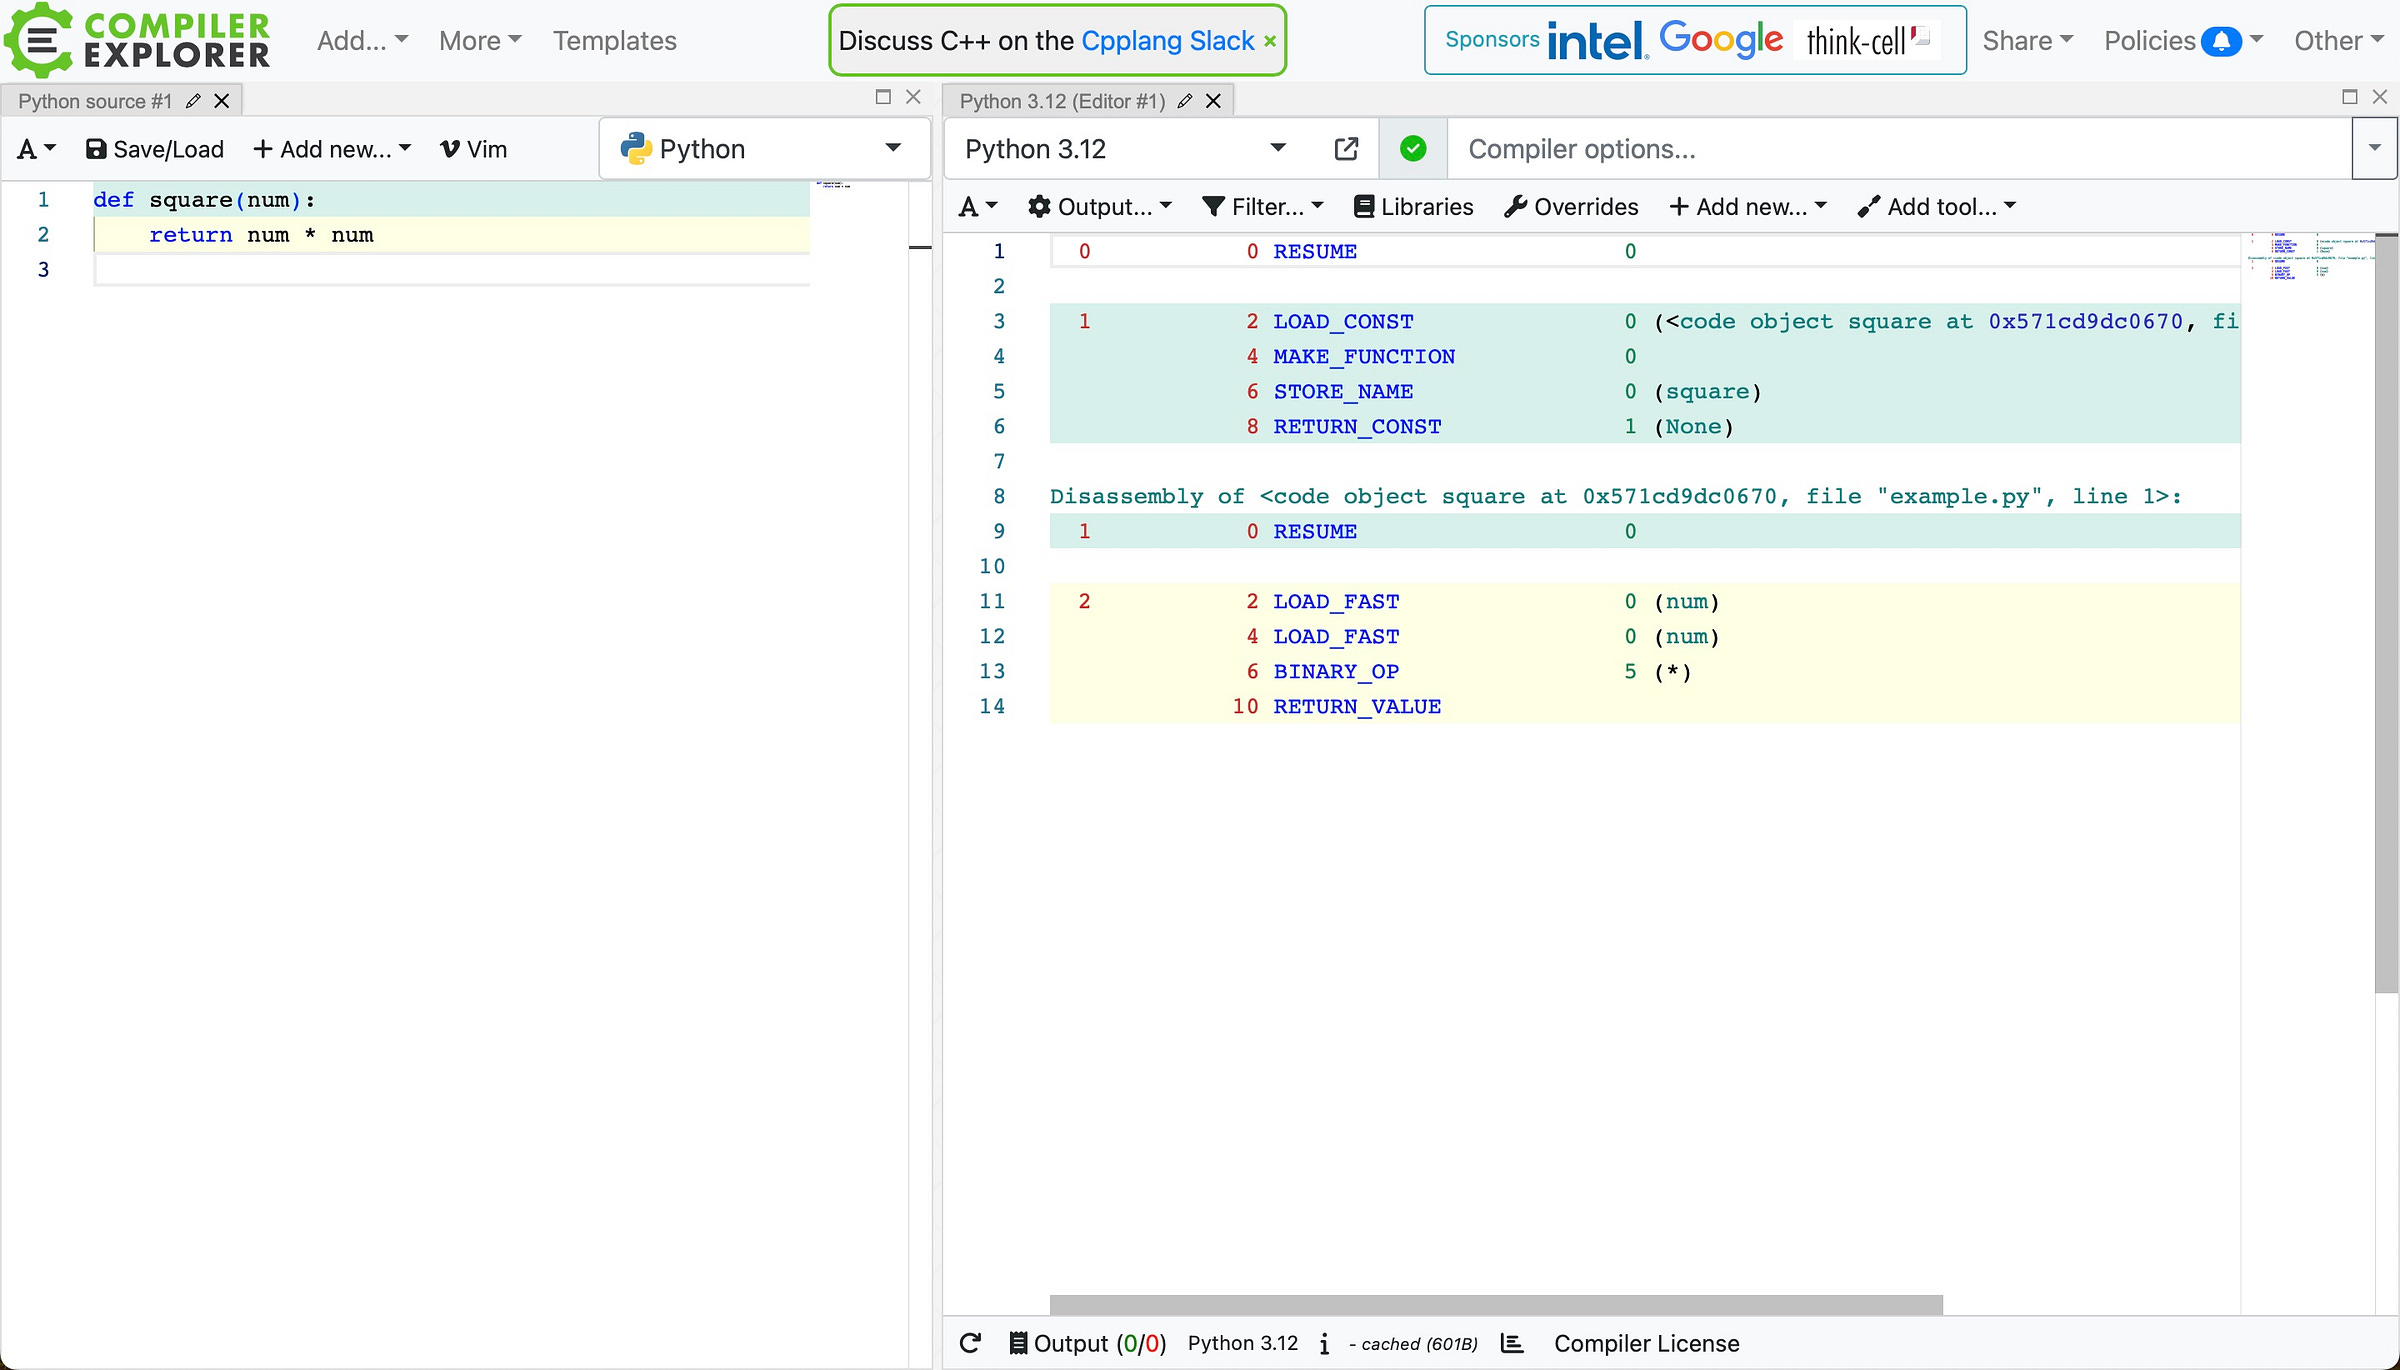
If you are interested in interpreted languages, like Python, then CE will show us the bytecode generated by the Python or Ruby interpreter. Here is a Python example.
CE Integrated Development Environment
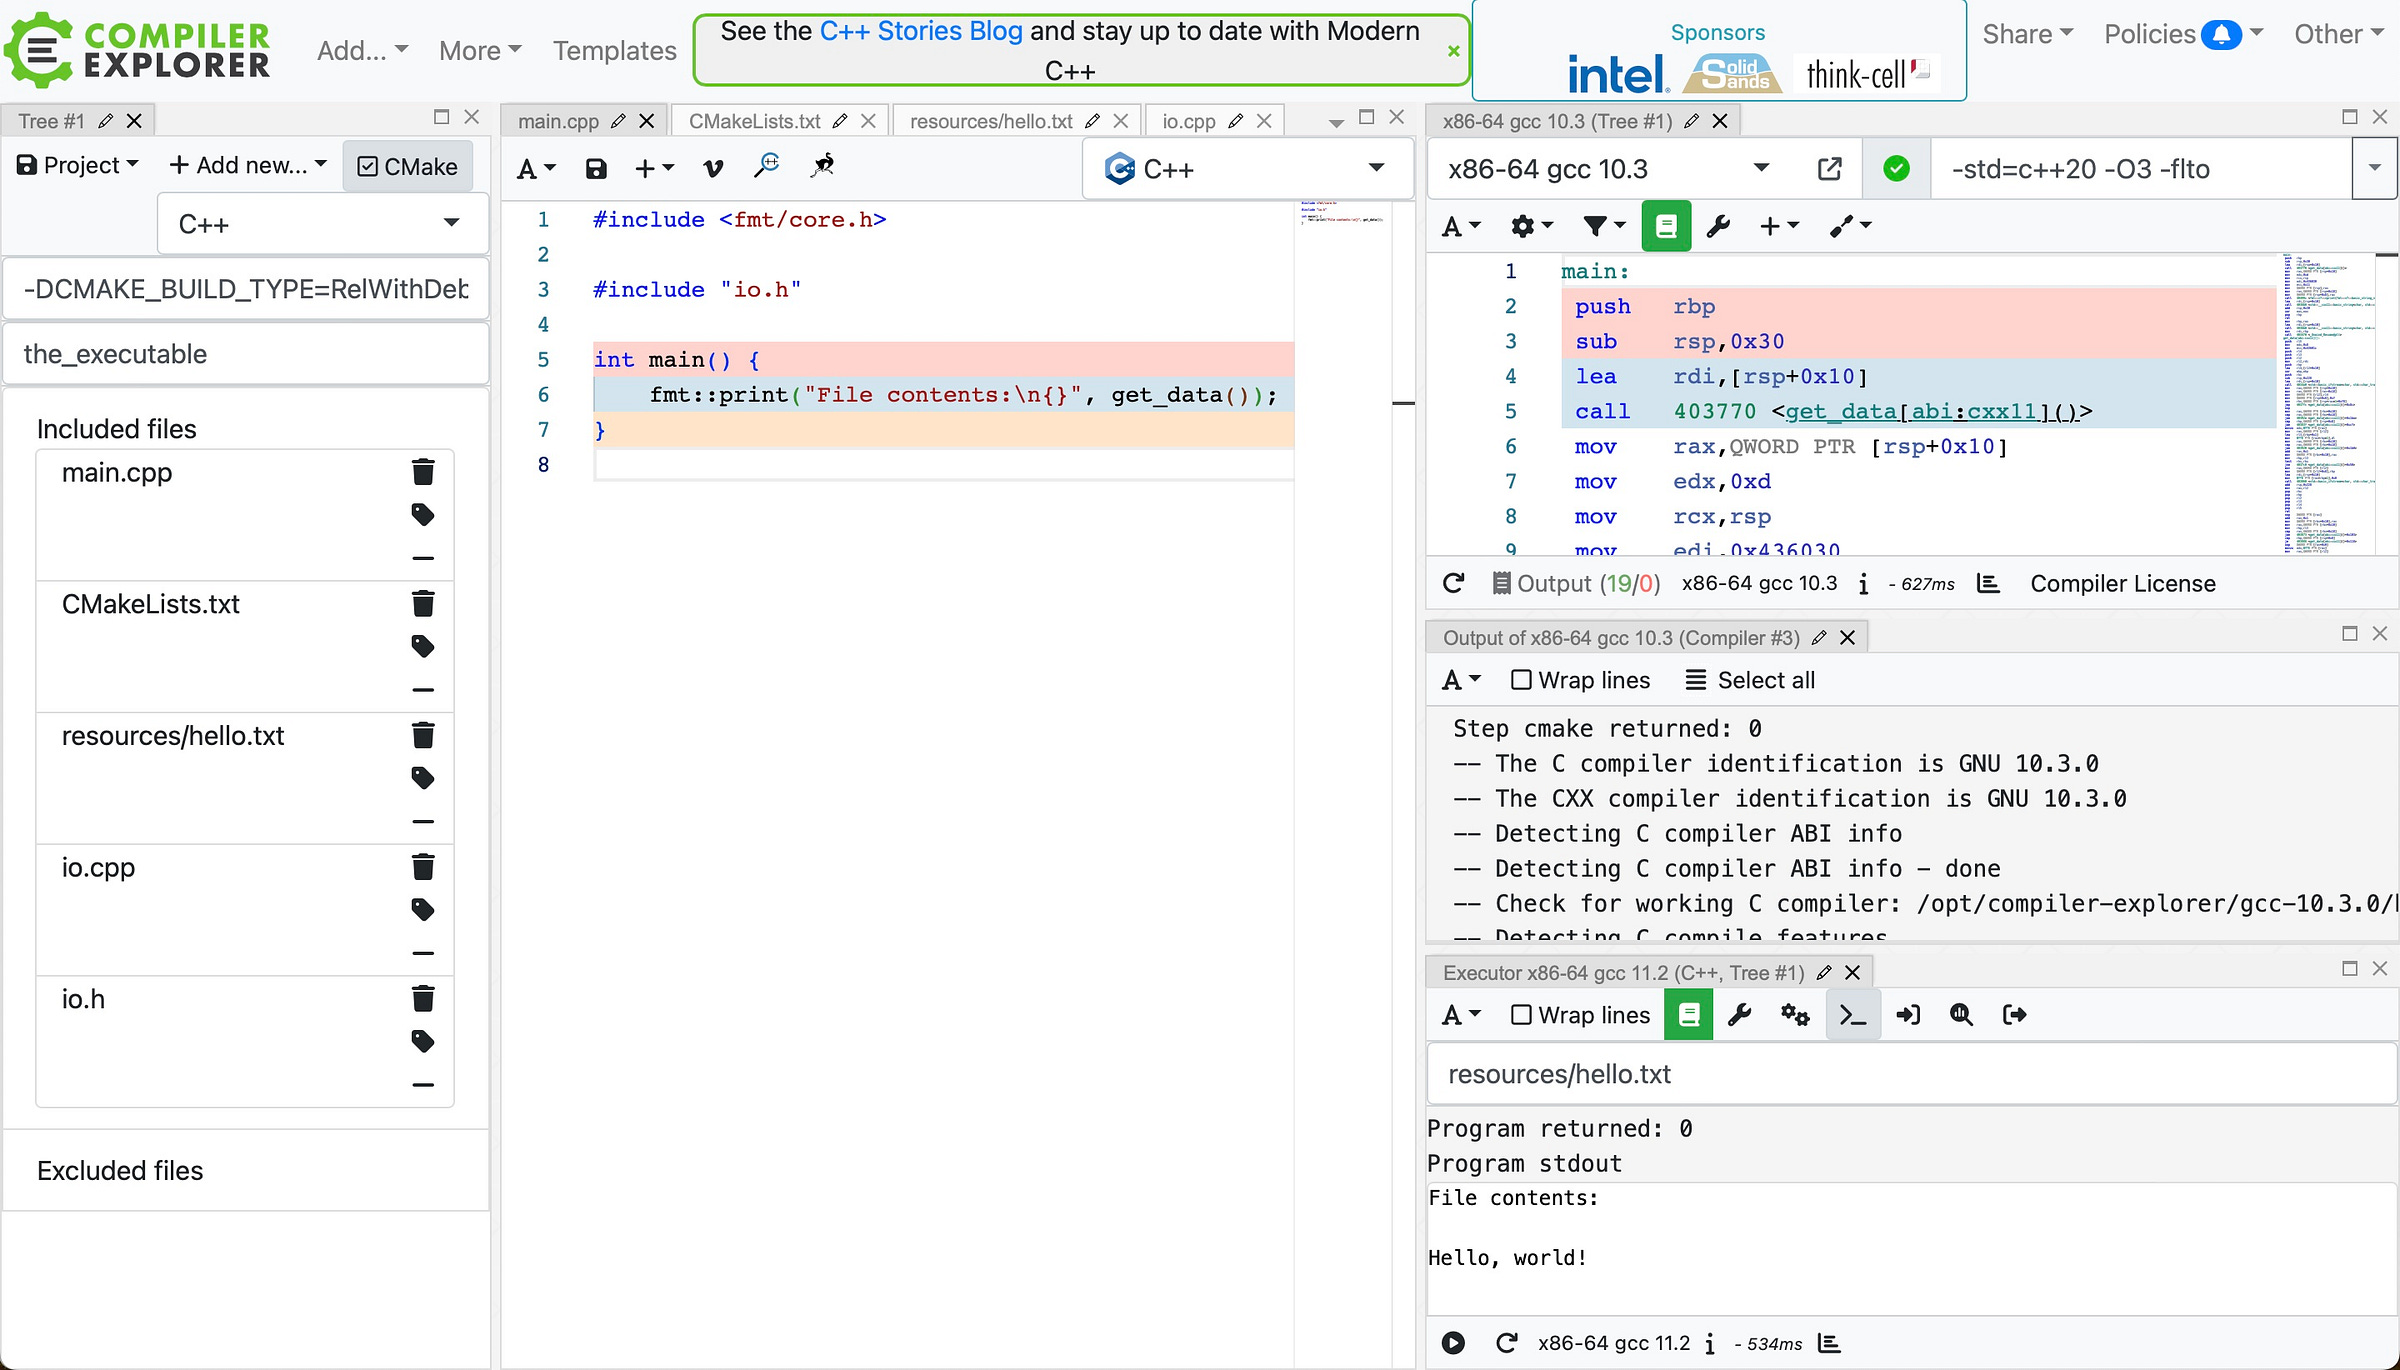
CE now even provides a simple complete IDE including CMake functionality and the ability to run programs and see the output.
Compiler Magic
One further use of CE is to enable us to see just how clever modern compilers are. Matt Godbolt has even given several talks on this. Here is one from 2017:
And more recently.
And an ACM paper Optimizations in C++ Compilers. From the introduction:
This article introduces some compiler and code generation concepts, and then shines a torch over a few of the very impressive feats of transformation your compilers are doing for you, with some practical demonstrations of my favorite optimizations. I hope you’ll gain an appreciation for what kinds of optimizations you can expect your compiler to do for you, and how you might explore the subject further. Most of all, you may learn to love looking at the assembly output and may learn to respect the quality of the engineering in your compilers.
CE Dashboards
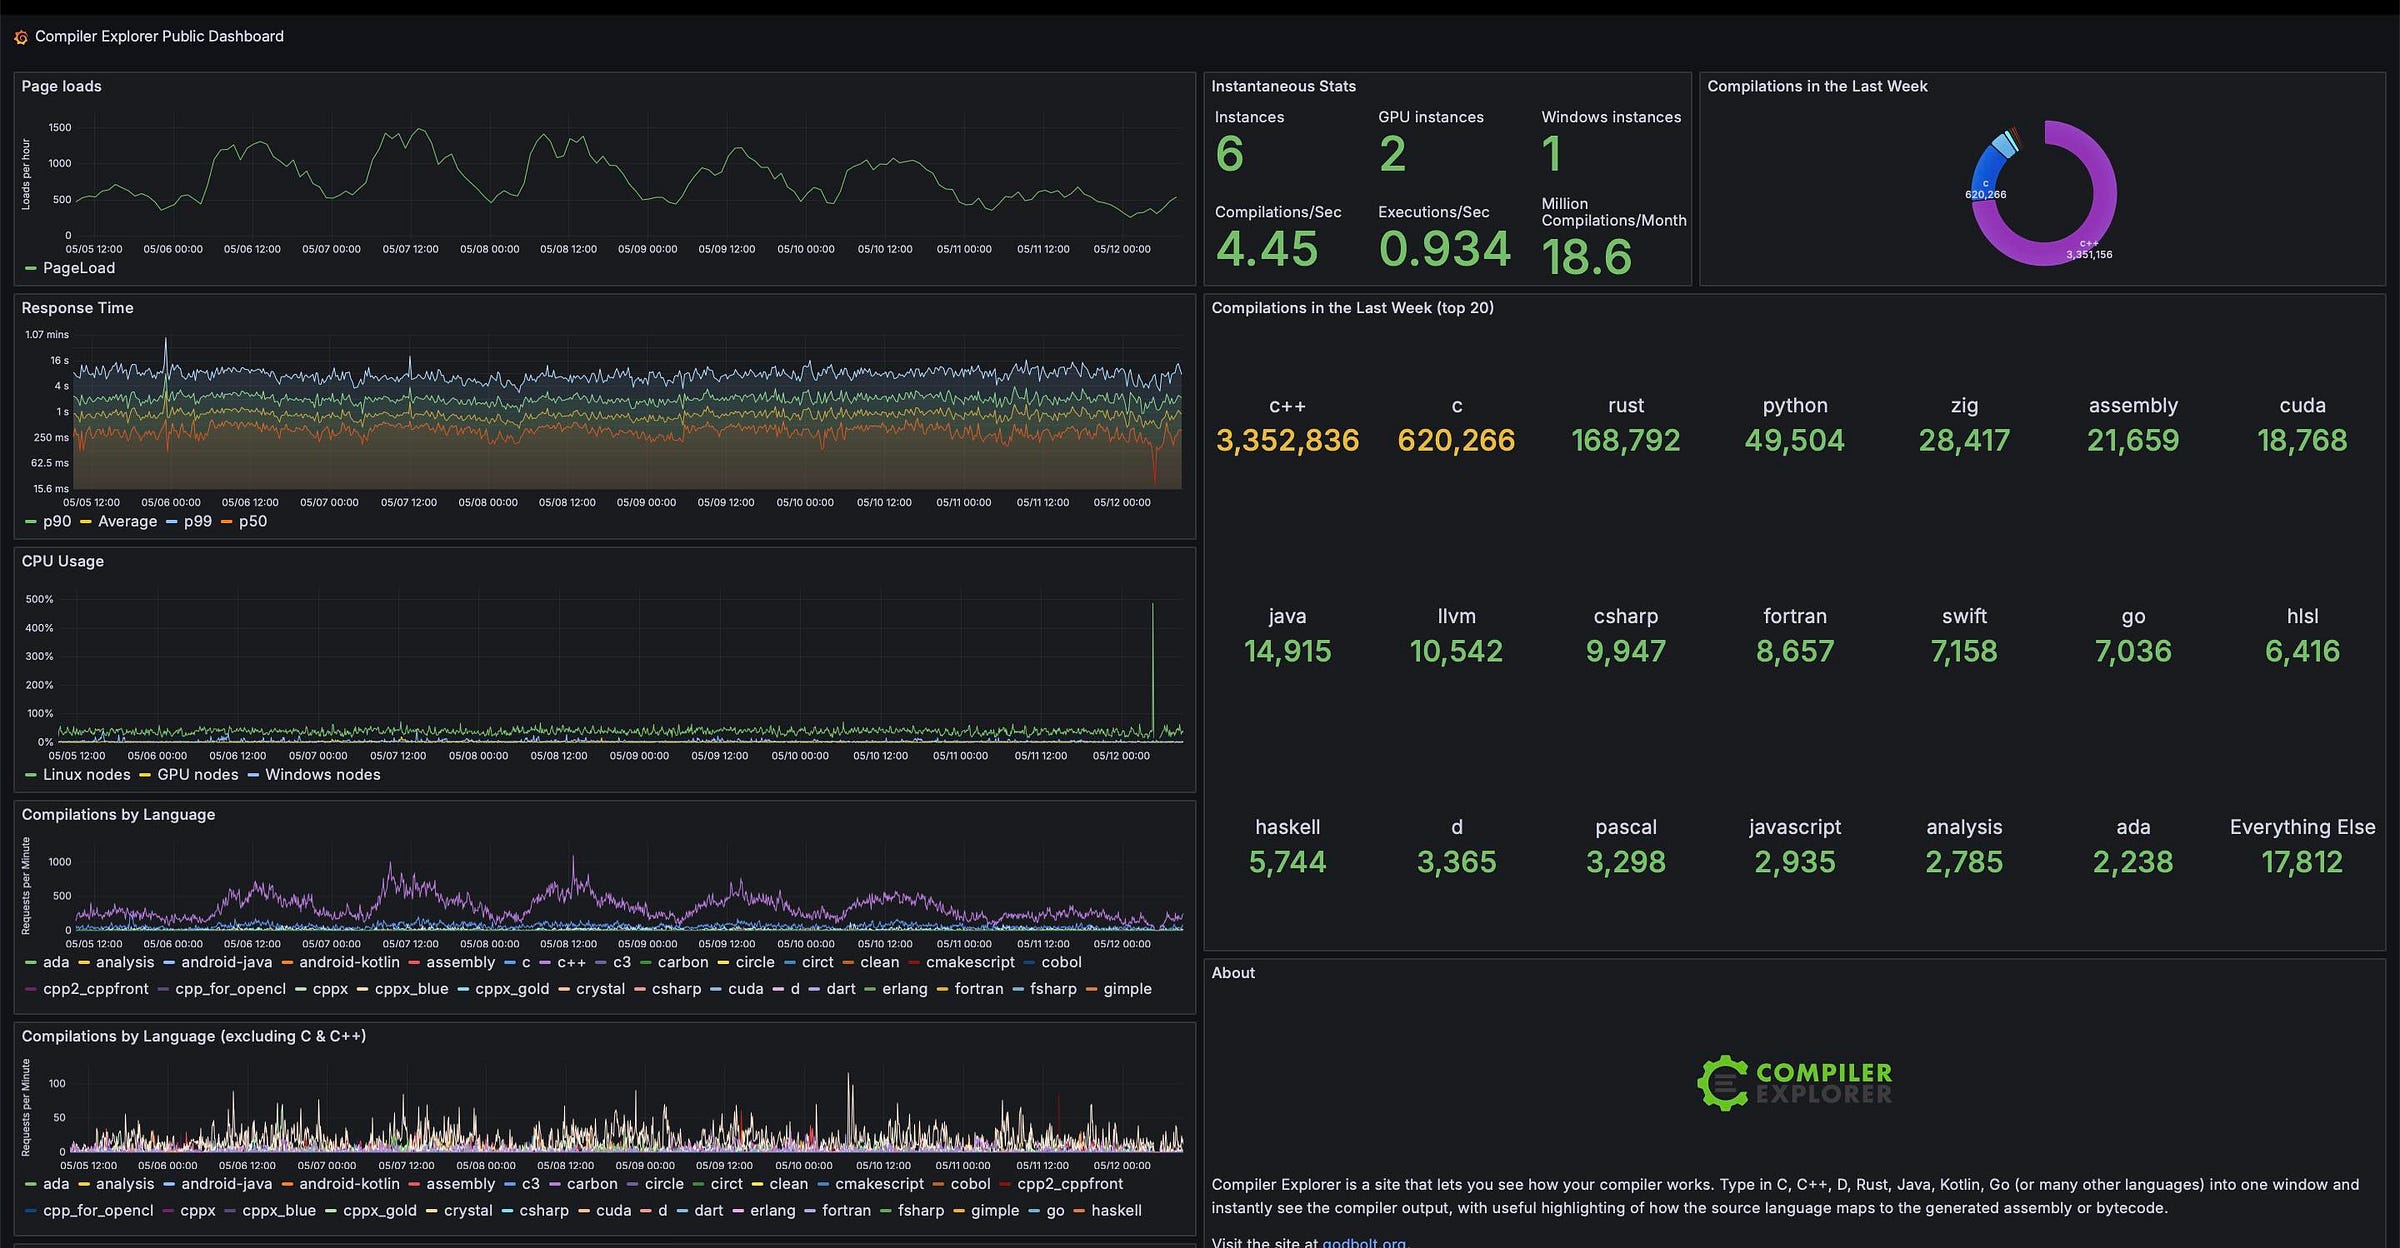
CE is even an interesting resource to see what languages users are working on, via the Grafana CE Dashboard.
C++ is the default language, so maybe we shouldn't read too much into that, but Rust being a quarter as popular as C is interesting.
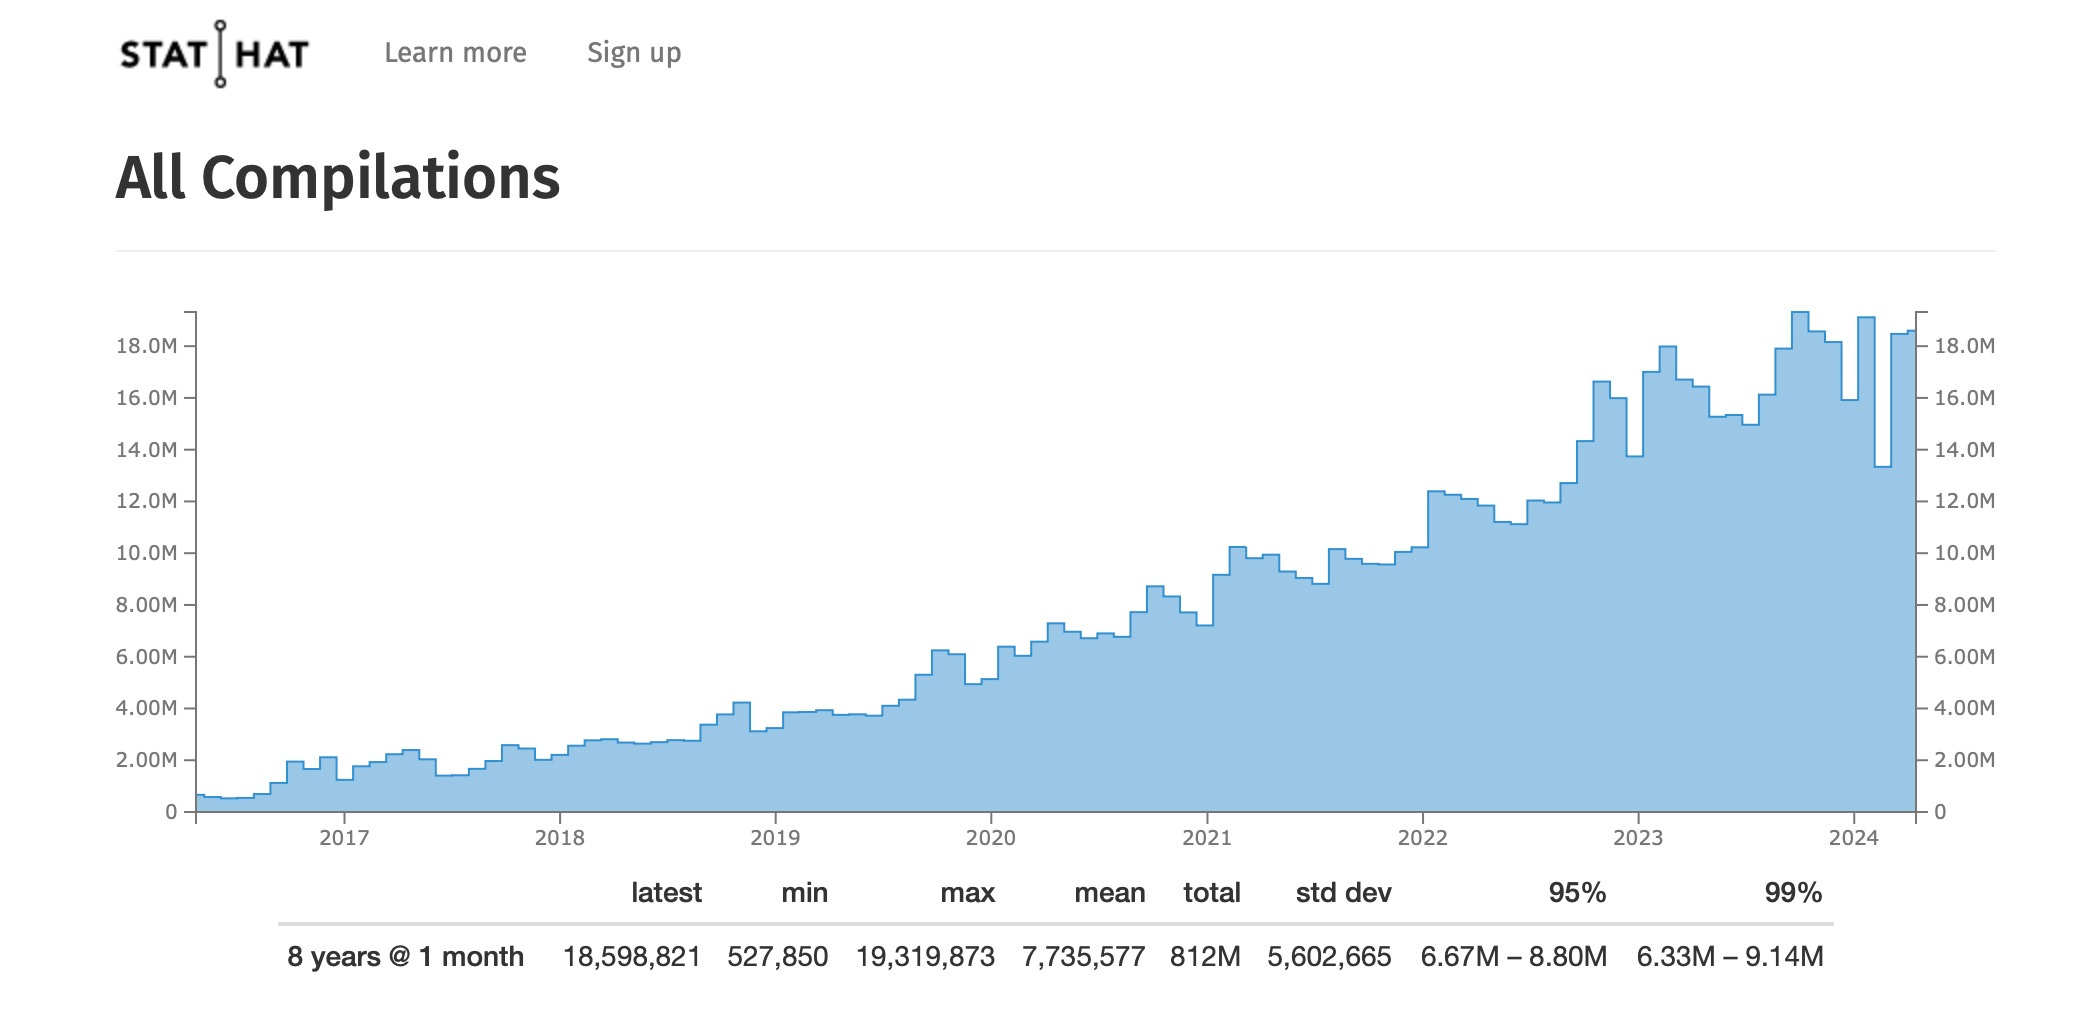
There is also a StatHat page that displays CE’s growth in usage over the years.
So use is currently running at around 18m compilations per year.
That’s roughly 1.5m per month, 50k per day, 2k per hour, 30 per minute, or one every two seconds. This all runs on Amazon Web Services and costs around $2,500 per month in hosting costs (an up-to-date value can be found on the CE Patreon).
Computerphile
If all this wasn’t enough then Matt is currently in the middle of a terrific series on the Computerphile YouTube channel that explains some of the basics of how microprocessors work. The first in the series is Machine Code Explained:
The rest of this series includes:
Hopefully, more to come!
Movfuscator
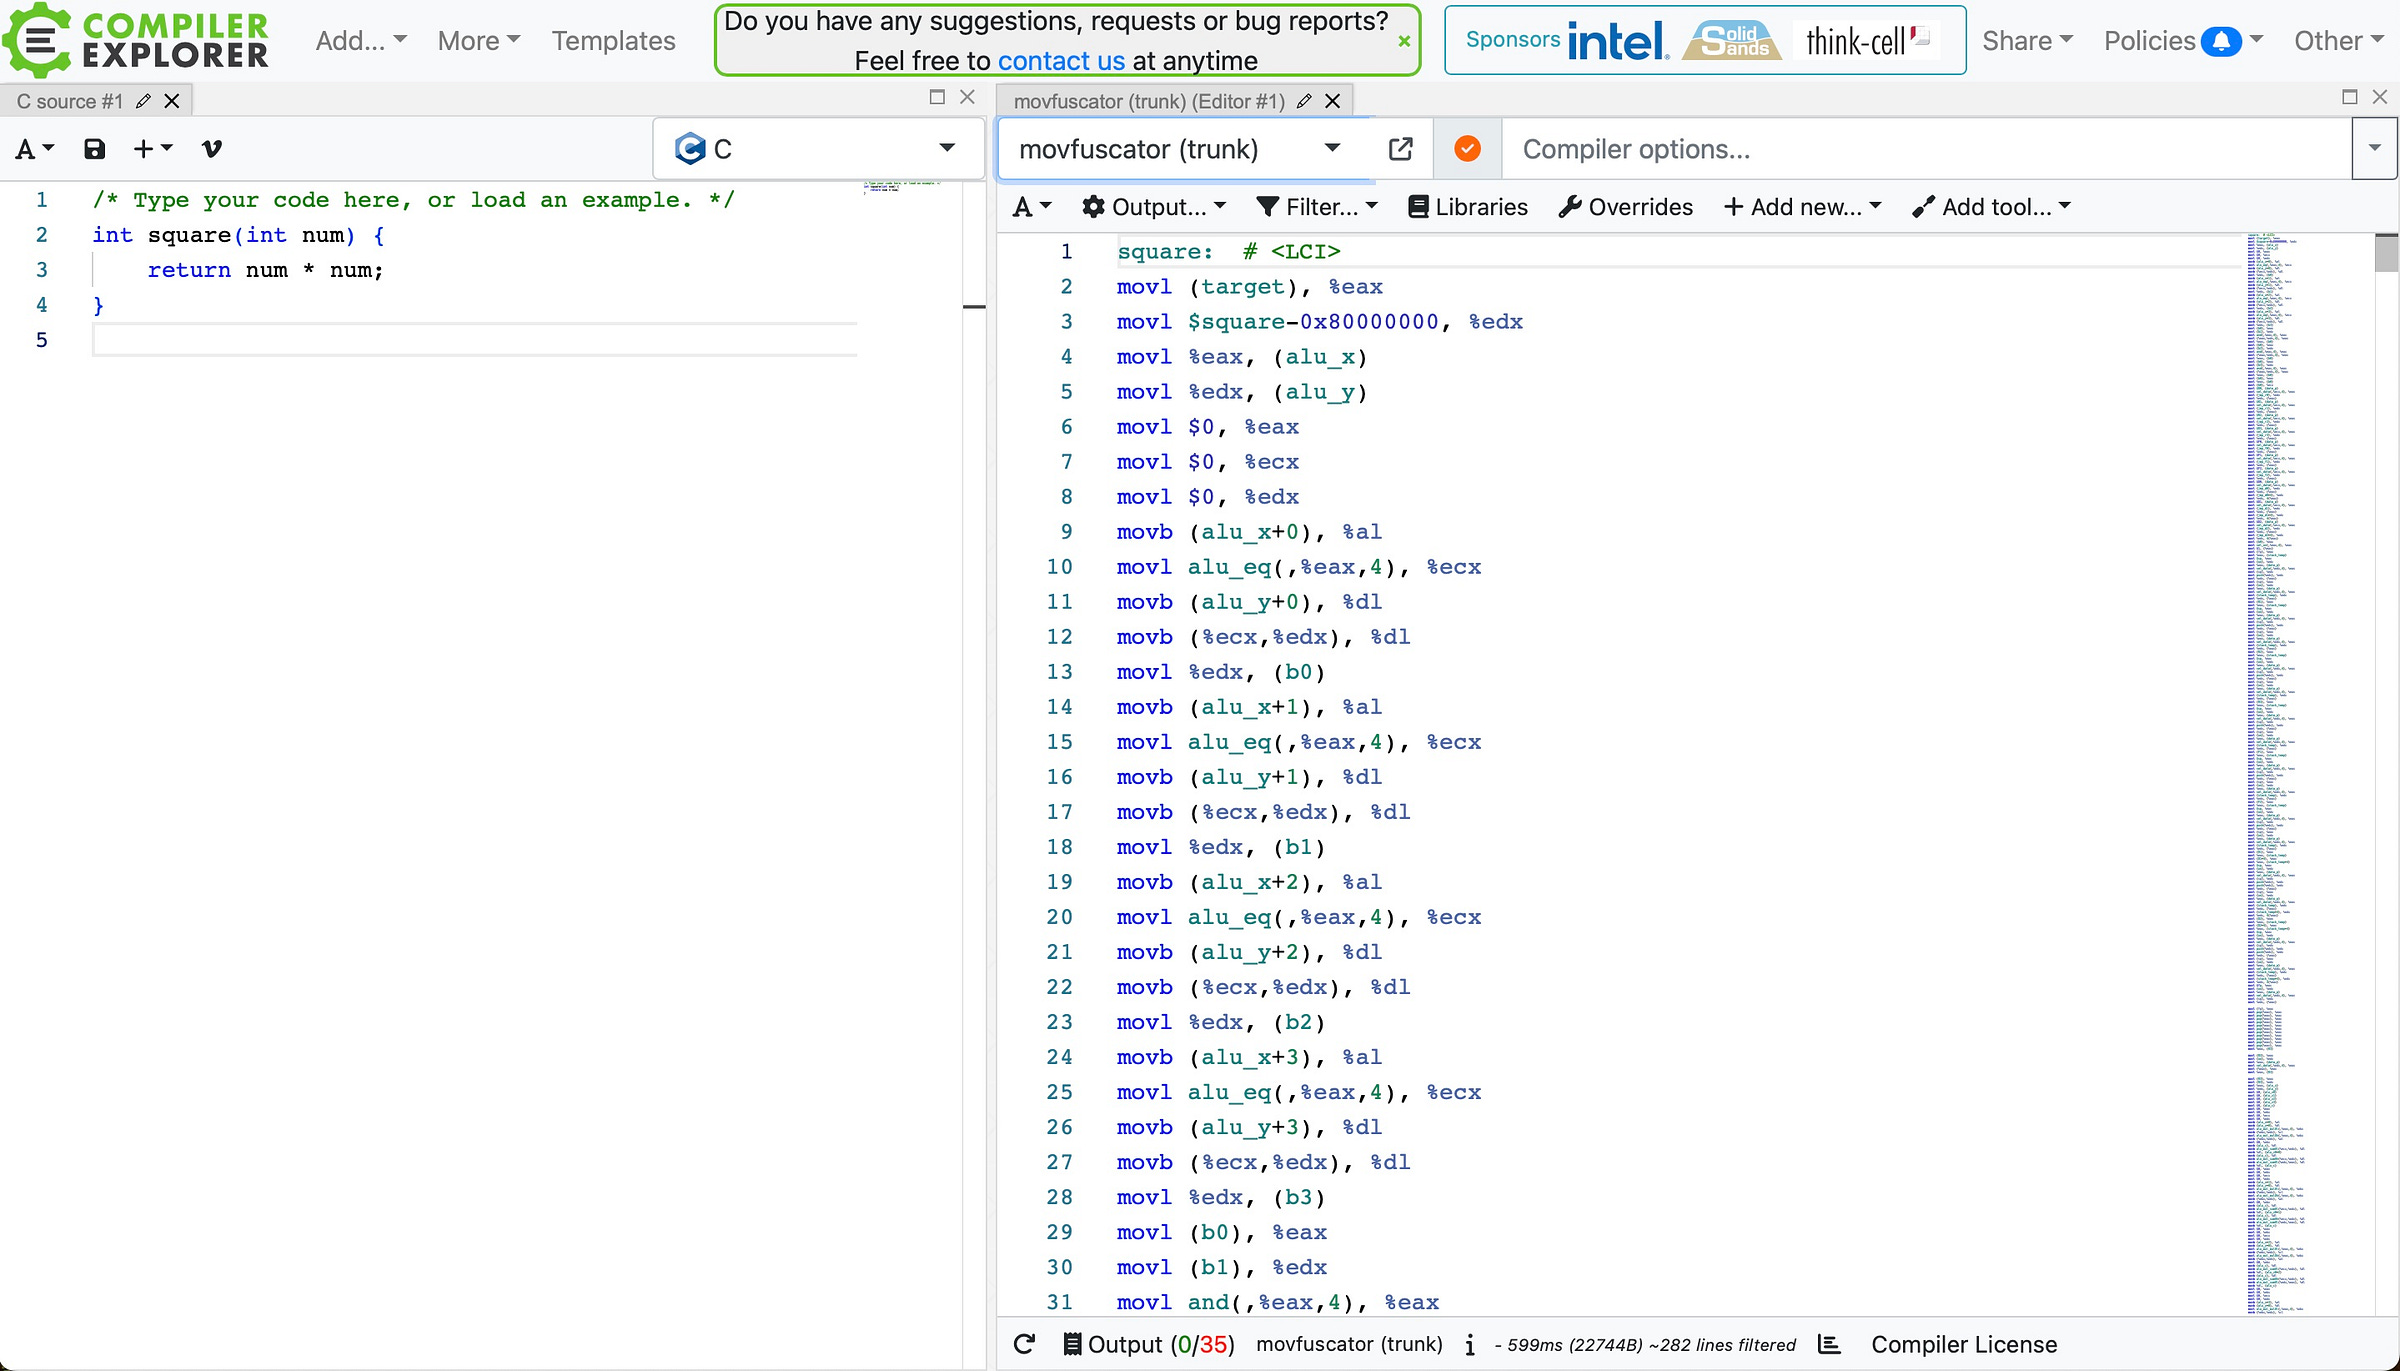
As a final example, on x86 the MOV instruction is Turing Complete. So here is our simple code compiled using movfuscator that uses only MOV instructions.



Nitpick... The patreon states $2500 per month, but article mentions per year
A couple of typos: you've misspelled "Matt Godbolt" (it's not "Goldbolt") in the article. The last name is the same as the domain name.